
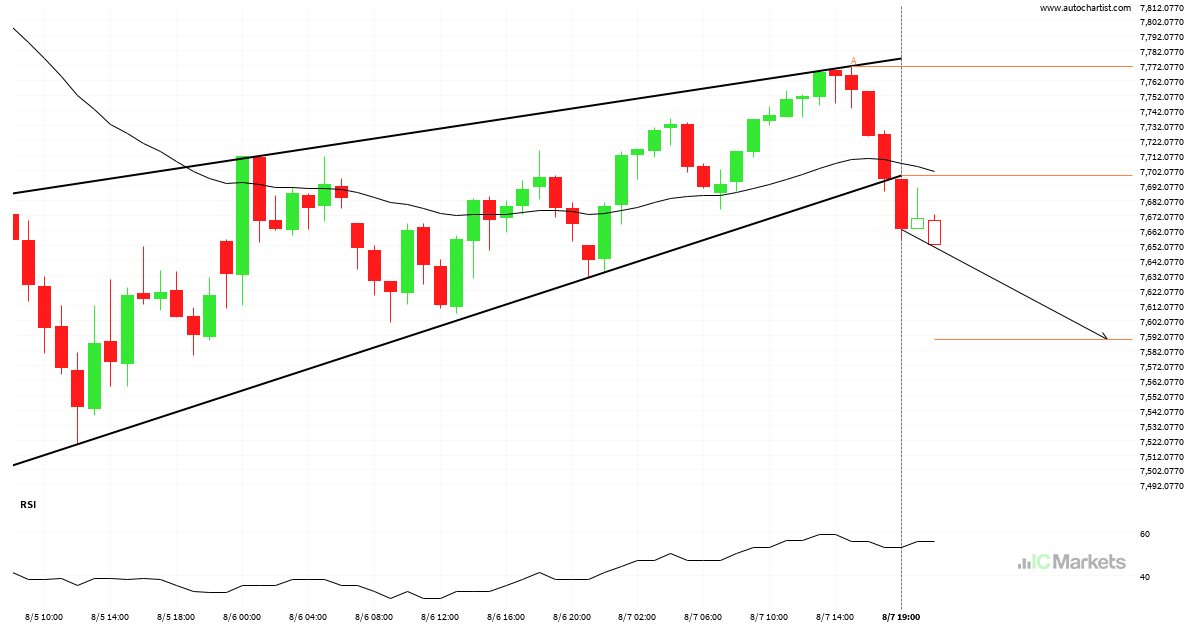
Rising Wedge breakout on Australia 200 Index
You would be well advised to confirm the breakout that has just occurred – do you believe the move through support to be significant? Do you have confirming indicators that the price momentum will continue? If so, look for a target of 7589.1660 but consider reducing the size of your position as the price gets […]
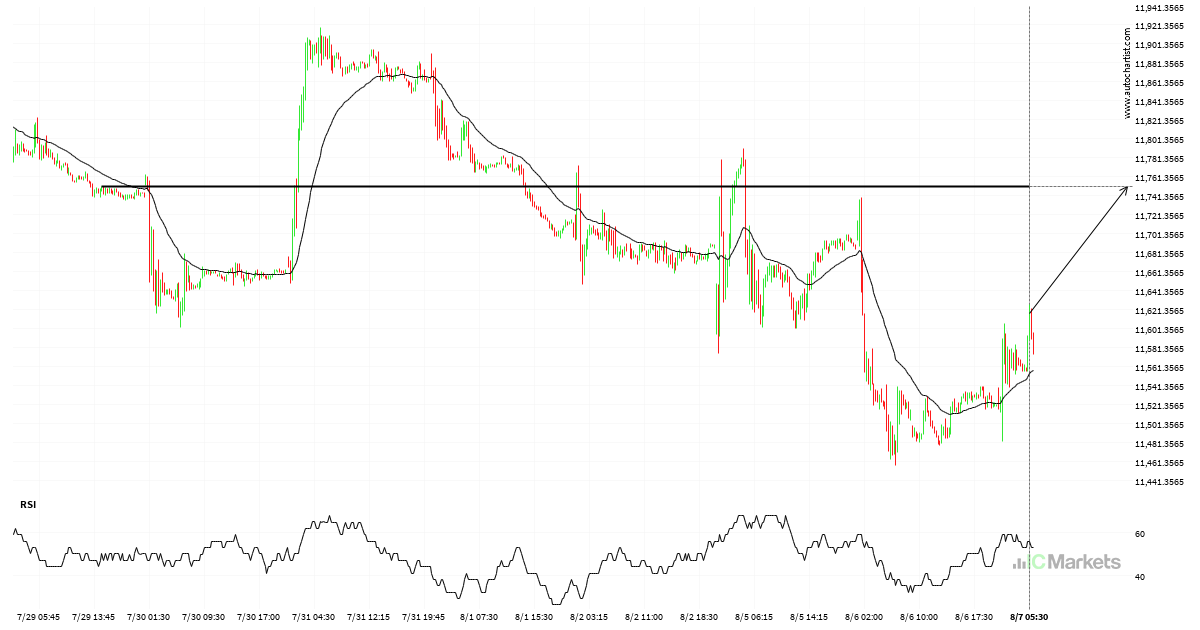
Should we expect a breakout or a rebound on FTSE China A50 Index?
The price of FTSE China A50 Index in heading back to the resistance area. It is possible that it will struggle to break through it and move back in the other direction. The price may eventually break through, but typically the price retreats from the level a number of times before doing so.
Possible breach of support level by Hong Kong 50 Index
Hong Kong 50 Index is trapped in a Falling Wedge formation, implying that a breakout is Imminent. This is a great trade-setup for both trend and swing traders. It is now approaching a resistance line that has been tested in the past. Divergence opportunists may be very optimistic about a possible breakout and this may […]
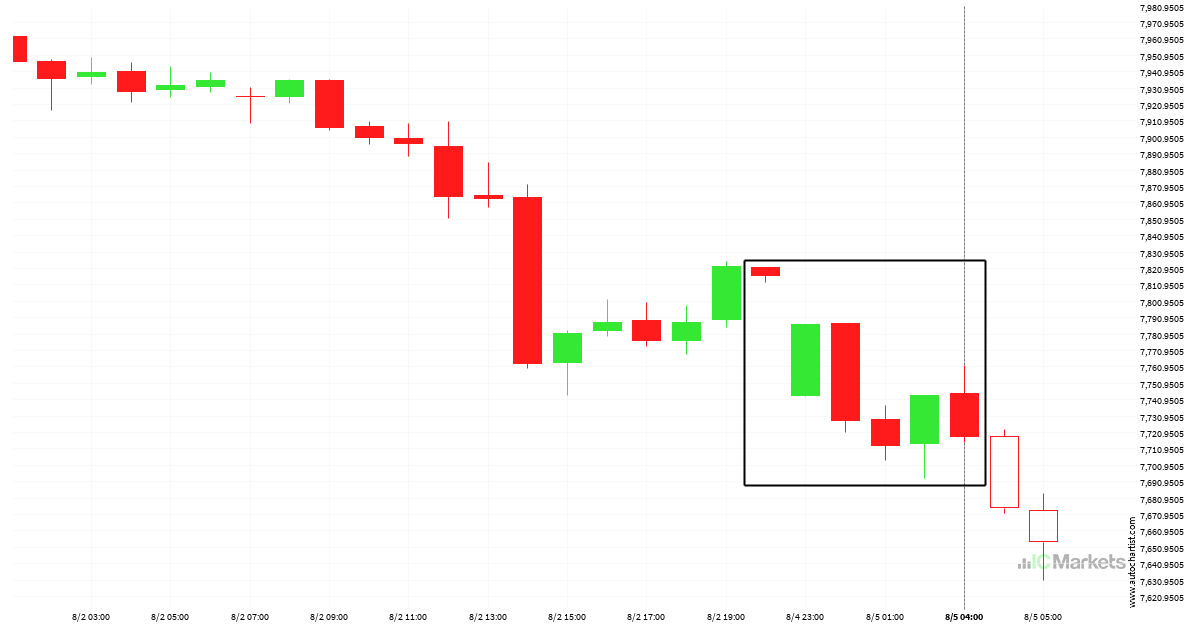
Dramatic change in Australia 200 Index. A sign of things to come?
Australia 200 Index hits 7722.66 after a 1.22% move spanning 3 days.
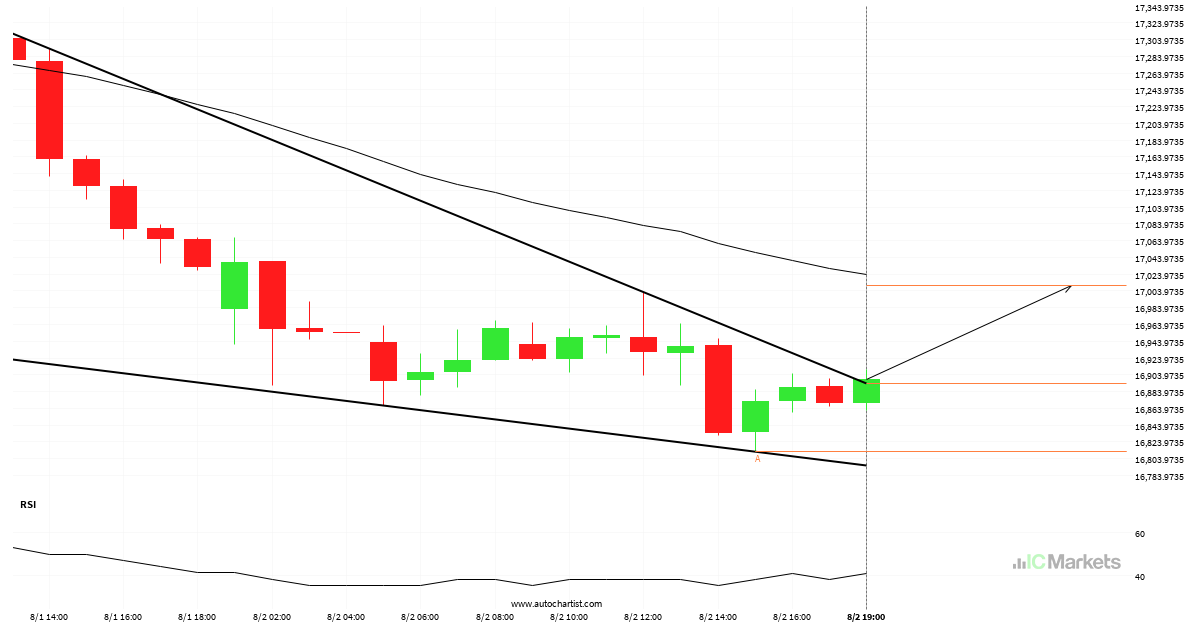
Hong Kong 50 Index breakout through resistance
Hong Kong 50 Index moved through the resistance line of a Falling Wedge at 16893.906250000004 on the 1 hour chart. This line has been tested a number of times in the past and this breakout could mean an upcoming change from the current trend. It may continue in its current direction toward 17009.9926.
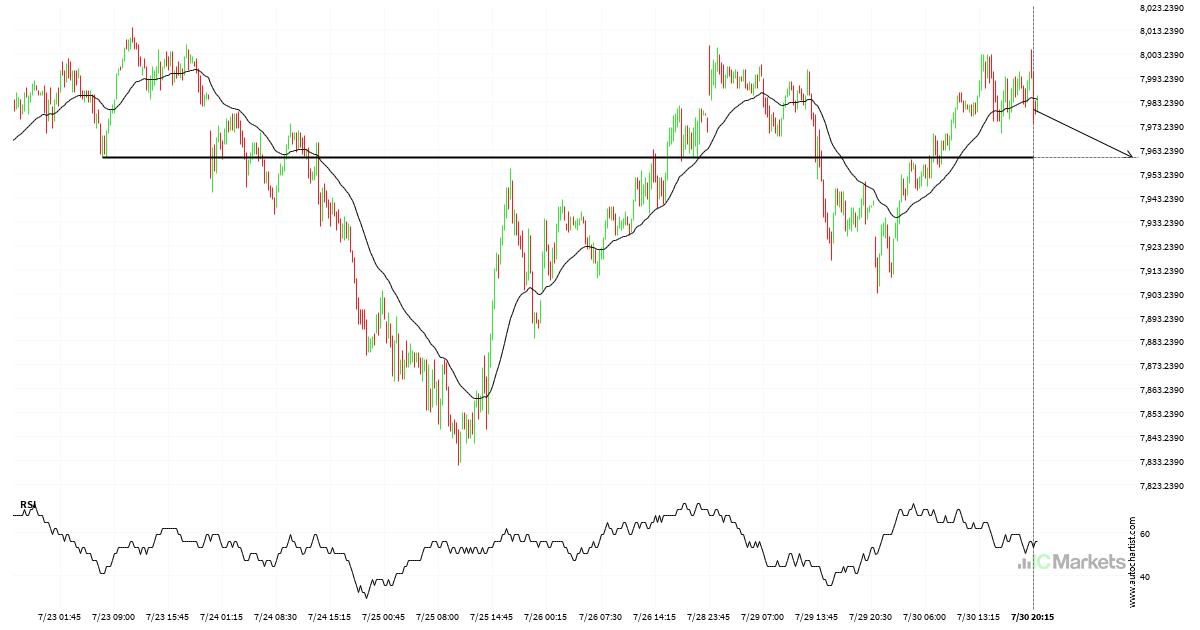
Australia 200 Index approaching support level
Australia 200 Index is heading towards a line of 7960.1001. If this movement continues, the price of Australia 200 Index could test 7960.1001 within the next 2 days. But don’t be so quick to trade, it has tested this line numerous times in the past, so this movement could be short-lived and end up rebounding.
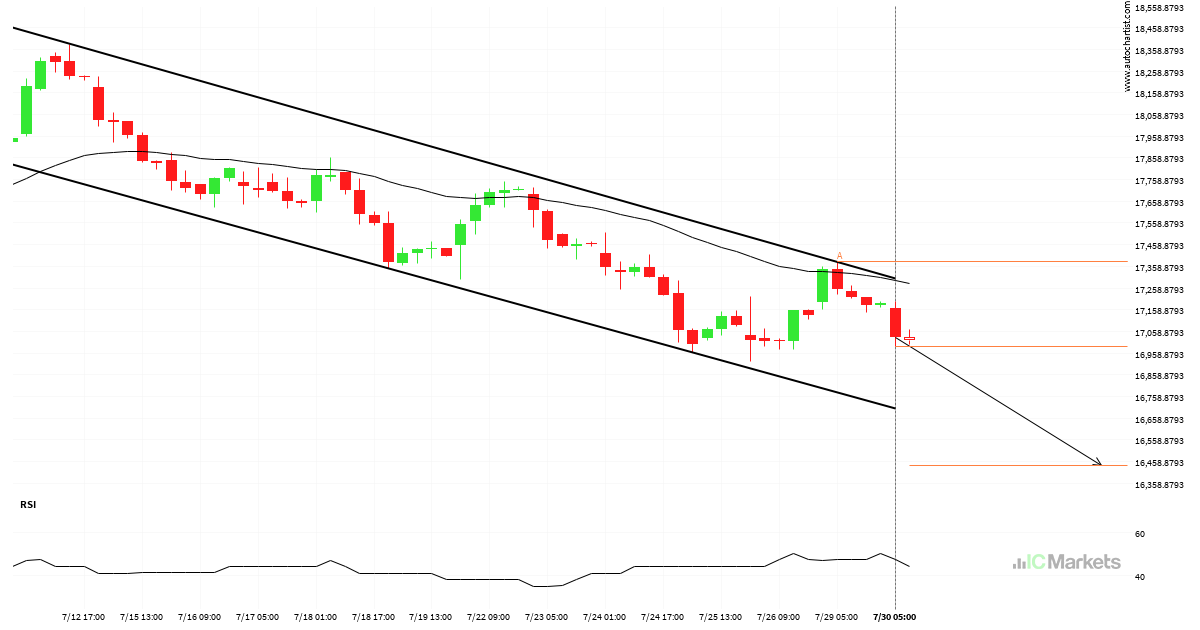
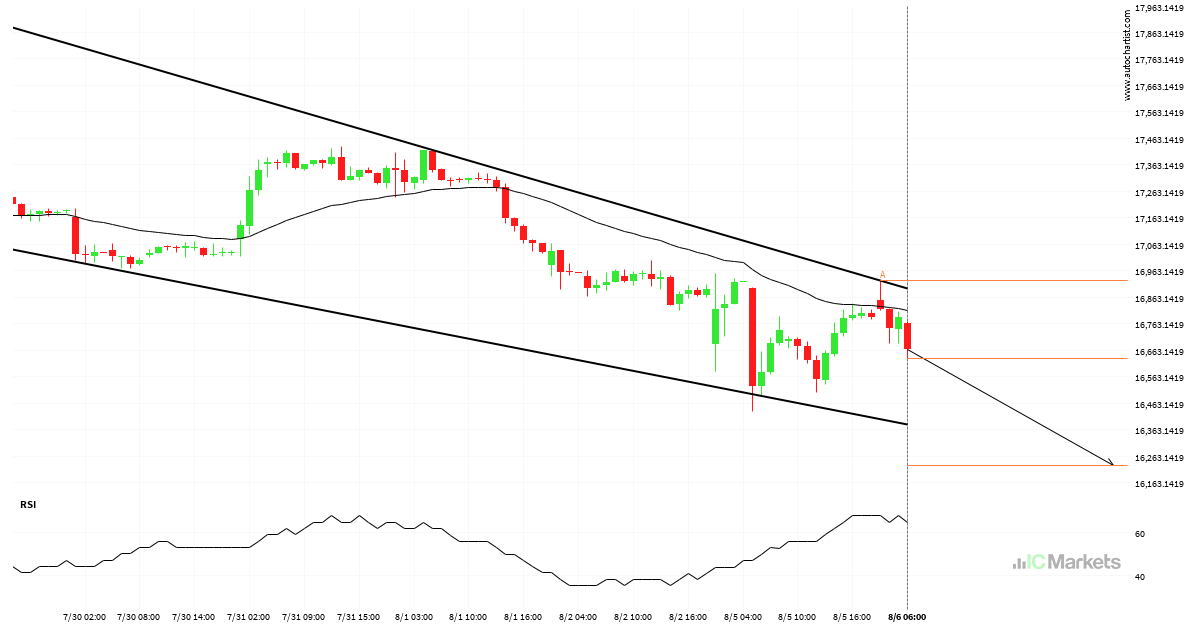
Will Hong Kong 50 Index have enough momentum to break support?
Hong Kong 50 Index was identified at around 16989.31 having recently rebounded of the resistance on the 4 hour data interval. Ultimately, the price action of the stock has formed a Channel Down pattern. This squeeze may increases the chances of a strong breakout. The projected movement will potentially take the price to around the […]

A potential bullish movement on Hong Kong 50 Index
Hong Kong 50 Index is moving towards a key resistance level at 17429.0195. Hong Kong 50 Index has previously tested this level 3 times and on each occasion it has bounced back off this level. Is this finally the time it will break through?
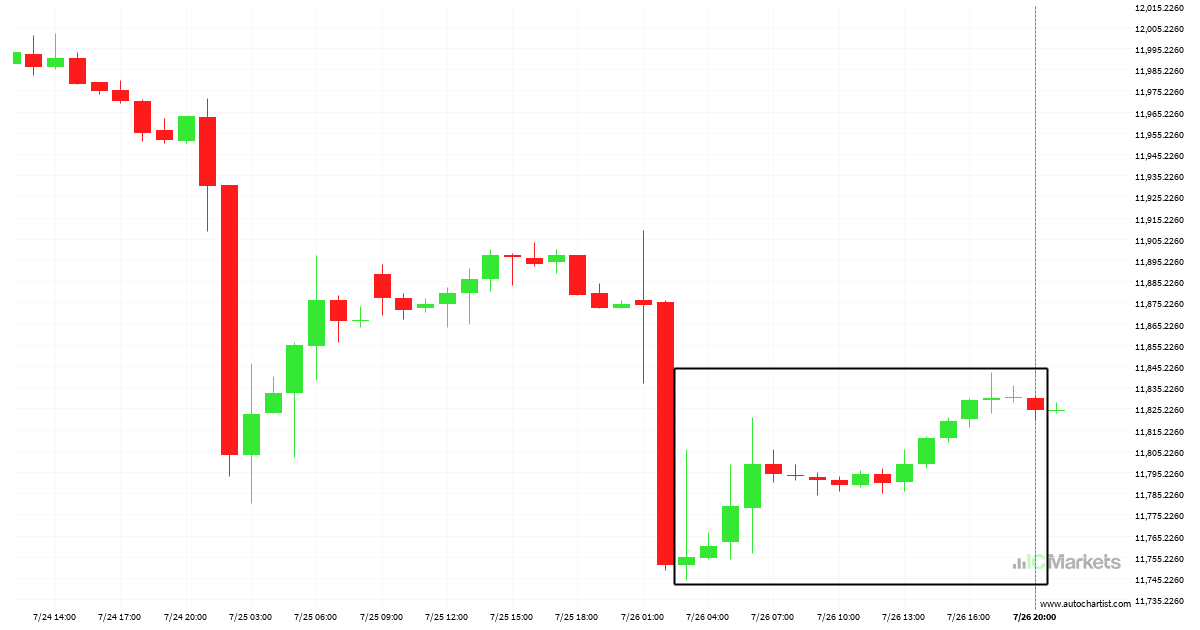
Where is FTSE China A50 Index moving to?
An unexpected large move has occurred on FTSE China A50 Index 1 hour chart beginning at 11750.8 and ending at 11829.2. Is this a sign of something new? What can we expect in the future?
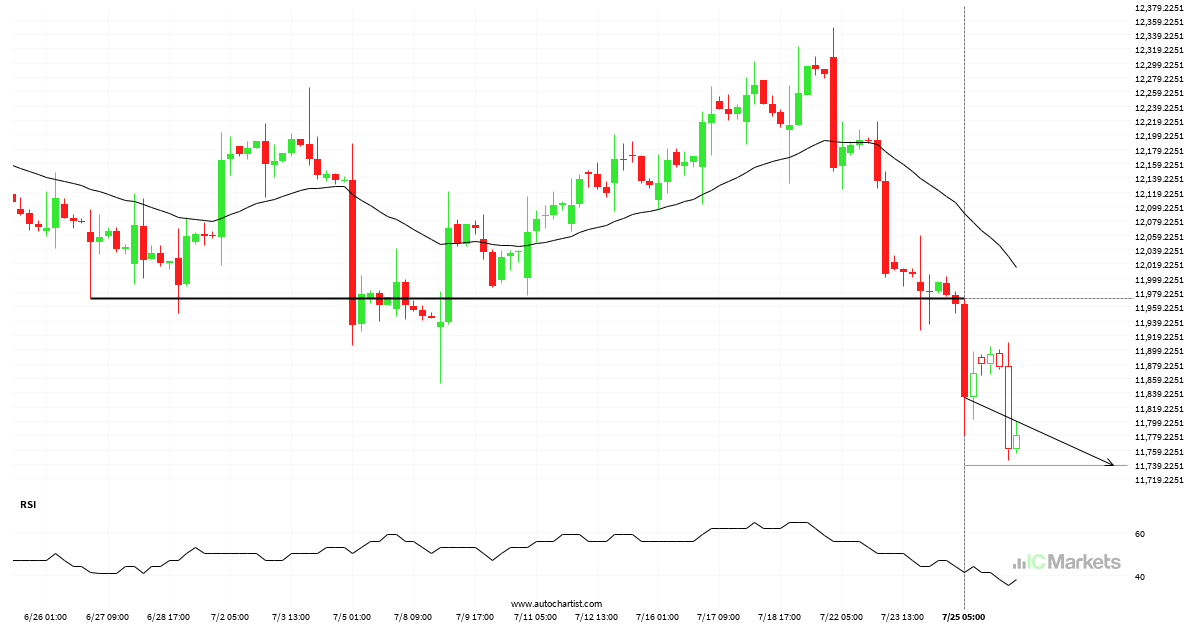
Should we expect a bearish trend on FTSE China A50 Index?
FTSE China A50 Index has broken through a support line. Because we have seen it retrace from this price in the past, one should wait for confirmation of the breakout before trading. It has touched this line numerous times in the last 29 days and suggests a possible target level to be around 11738.4082 within […]